12/28/2015

CPR compressions in a strip


Figure 1

After the VT was recognized, compressions were started. As you can see on the arterial line, compressions generated (as registered on the graph) pressures of about 80-100. 

Earlier study mentioned pressured of 60-80 during compression. They used pneumatic compression device at a compression rate of 60/min (study done in 1989). 

This strip captured and emphasized high quality compression. The patient in this case was converted back to SR and got adequate pressures.

Reference:

Paradis N. et al. 1989. Simultaneous aortic, jugular bulb, and right atrial pressures during cardiopulmonary resuscitation in humans. Insights into mechanisms. Circulation. 1989;80:361-368


#259

Pulseless Electrical Activity


Figure 1

This strip (20 second) is captured during a code. This strip also captured the ff (top to bottom): leads II and V1, SPO2, RR, arterial line (blood pressure-BP), CV2 (central venous pressure-CVP).

The initial part of the strip is showing a wide QRS rhythm and maybe distorted by the (on-going) compression.  At that time, the generated arterial pressure is about 80 mm Hg. The middle black line is the shock delivered. After that is an organized wide QRS rhythm (~15 sec). At the arterial line tracing, the line seemed flat (no BP/pulse). So this wide QRS rhythm after the shock is called pulseless electrical activity (PEA).

#258

Second degree AV block type I interrupted by nonconducted PAC's in bigeminy


An elderly was being worked-up for GI bleed and routine monitoring captured this (rates dropping to 40's). 


Figure 1

What is the rhythm diagnosis? 

*****


Figure 2

The baseline rhythm is sinus rhythm at  a rate (initially) about 75 bpm. The first 4 QRS beats had a prolonged PRI (~ 360 ms) . The next subsequent beats (~ 40 bpm) with a PRI of ~ 280 ms. This behavior is seen in Wenckebach type of block.

What is the probable cause of the sudden onset of bradycardia? (red arrows - P waves)

There is a small nib at the terminal portion of the 4th QRS complex.The nibs are distorting the shape of the 4th QRS complex  compared to the first 3 QRS complexes (best seen in I, III, aVF, aVL). In the subsequent bradycardic QRS complexes, nibs can all be seen (best seen in V1 in the  ST segment). These are P waves. The differential here can be non-conducted PAC's or atrial echos (reentry). The RP interval of those P waves  vary (shorter in the 4th QRS complex than the rest). Thus this is more of a PAC than a reentry.

Interpretation: 

SR with a prolonged PRI with a Wenckebach periodicity interrupted with non-conducted PAC's, RBBB.

Patient was asymptomatic during these events.

#255

12/27/2015

Phasic sinus arrhythmia


In sinus arrhythmia, the sinus rhythm is irregular. the P wave and PR interval are normal and the PP interval VARIES BY MORE THAN APPROXIMATELY 0.16 sec. There are 3 types.


Figure 1 (Phasic sinus arrhythmia)

Phasic (respiratory) sinus arrhythmia is one of the 3 variants/kinds/type of sinus arrhythmia. The other 2 are nonphasic sinus arrhythmia and ventriculophasic sinus arrhythmia. With phasic sinus arrhythmia, the rate is dependent on the respiratory cycle, increasing during inspiration and decreasing during expiration. The pacemaker site within the SAN shifts with respiration. As the heart rate  increases the pacemaker site moves higher to the sinoatrial node (SAN) and the P wave amplitude increases (II, III and aVF). As the heart rate decreases the pacemaker sites moves lower the SAN and the P wave amplitude decreases. The heart rate changes rhythmically and gradually which differentiates it from nonphasic sinus arrhythmia.

Reference:

Fisch C and Knoebel SB. 2000. Electrocardiography of Clinical Arrhythmia. New York. Futura Publishing Co.

#253

What is this wide rhythm?


A 75 yo h/o HTN, DM, dyslipidemia and non-ischemic caridomyopathy. What is your interpretation?


Figure 1

This is sinus tachycardia (~125 bpm), second degree AV block type 1 (Mobitz I/Wenckebach), left bubndle branch block (LBBB), left axis deviation, poor R wave progression.

Distinct P waves are marked in red arrows. Blue arrows marked the non-conducted P waves of the Wenckebach cycle. After the conducted beats, most of the P waves are hidden from view or are buried in the T waves or distorting the T wave morphology. The 5th to the last R wave could be a premature junctional beat. The nondconducted P wave is hidden or buried on that wave.


Figure 2

#622


WAP/MAR/MAT/Sinus arrhythmia


This pt admitted had a hx of COPD and pulmonary fibrosis c/o of dyspnea.


Figure 1


What is the rhythm


Figure 2 (marked)

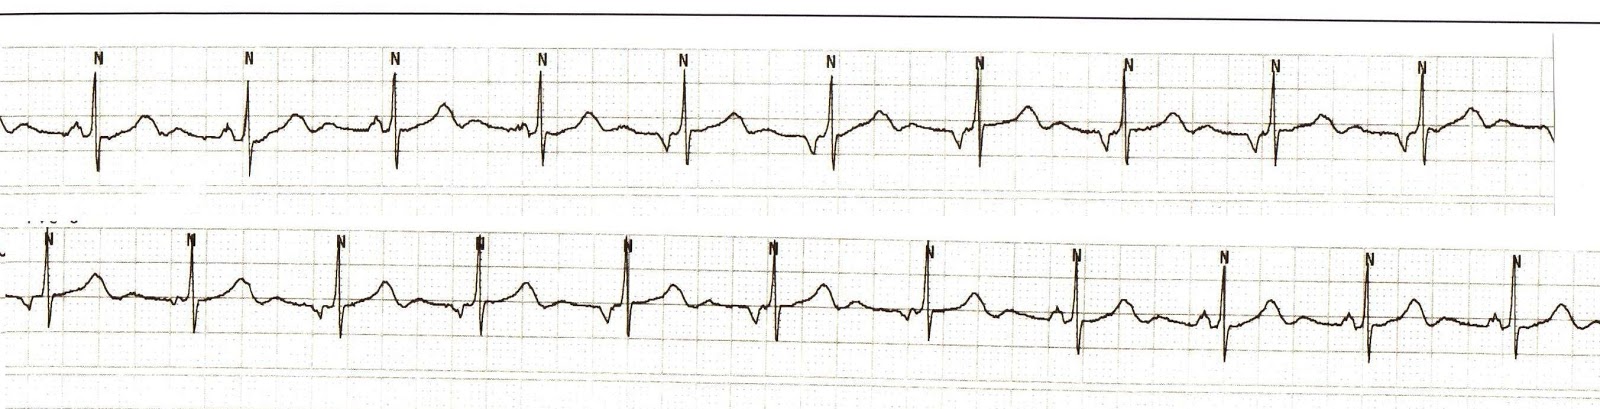
This is an irregular rhythm with SEVERAL P wave morphologies. All identifiable P waves are numbered in red in V1. The R to R intervals ranges from a rate of 46 bpm to about 150 bpm. You might be tempted to call this sinus rhythm with premature atrial beats but the inverted P wave (P6) before R4 is not premature. So, this is not a PAC.

The different P wave morphologies mean that they are coming from multiple ectopic atrial foci. You might also be tempted to call this wandering atrial pacemaker (WAP).

The Definition WAP from Different Books

According to ECG's Made Easy (2nd ed):

"Mulfocal atrial rhythm (MAR) is an updated term for the rhythm wandering atrial pacemaker (WAP). With this rhythm,, the size, shape, and direction of the P waves vary, from beat to beat to beat. The difference in P wave configuration reflects GRADUAL SHIFTING of the dominant pacemaker between the SA node, the atria, and/or the AV node. At least 3 different P wave configuration, seen in the same lead, are required for the diagnosis. "

Comment: If you only read one book or some basic introductory books in ECG interpretation, you will be convinced that MAT and and WAP are the same. However, they are not. The author even mentioned that "WAP may occur in some organic disease and with digitalis toxicity." However, as will be mentioned here, WAP is a NORMAL phenomenon. The lesson here is do not (just) trust one book or reference but read more books/journals.


WAP according to Braunwald's Heart Disease A Textbook of Cardiovascular Medicine (10thed) :


Wandering Atrial Pacemaker (WAP)
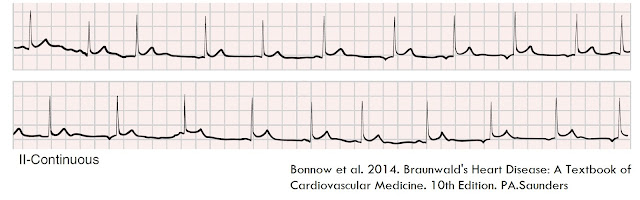


Figure 3


"This VARIANT OF SINUS ARRHYTHMIA involves passive transfer of the dominant pacemaker focus from the sinus node to latent pacemakers that have the next highest degree of automaticity located in other atrial sites (usually lower in the crista terminalis) or in AV junctional tissue. The change occurs in a GRADUAL fashion over the duration of several beats; thus, only one pacemaker at a time controls the rhythm, in sharp contrast to AV dissociation. The ECG (Figure 3) displays a cyclical increase in the R-R interval—a PR interval that gradually shortens and can become less than 120 milliseconds and a change in the P wave contour that becomes negative in lead I or II (depending on the site of discharge) or is lost within the QRS complex. In general, these changes occur in reverse as the pacemaker shifts back to the sinus node. Wandering pacemaker is a normal phenomenon that often occurs in the very young and particularly in athletes, presumably because of augmented vagal tone. Persistence of an AV junctional rhythm for long periods, however, may indicate underlying heart disease. Treatment is not usually indicated but, if necessary, is the same as that for sinus bradycardia."

Comment: WAP is a variant of sinus arrhythmia (SA). Let us touch a little of SA.

Sinus Arrhythmia

In sinus arrhythmia, the rhythm is irregular. The P wave and PR interval are normal. The P to P interval varies by 0.16 sec There are 3 types: phasic or respiratory, nonphasic or nonrespiratory and ventriculophasic. 

Phasic Sinus Arrhythmia


Figure 4 - Phasic Sinus Arrhythmia


With phasic SA (Figure 4), the rate is dependent on the respiratory cycle, increasing with respiration and decreasing with expiration. The pacemaker site in the sinoatrial node (SAN) shifts with respiration. The pacemaker site shifts higher the SAN, the heart rate and P wave amplitude in II, III and aVF increase. As the pacemaker shifts lower the SAN, the P wave amplitude and heart rate decrease. The heart rate changes gradually and rhythmically, thus differentiating it from non-phasic sinus arrhythmia. 

Non-phasic sinus arrhythmia


Figure 5 - Non-phasic sinus arrhythmia

For non-phasic (Non-respiratory) Sinus Arrhythmia (Figure 5), the P wave and PR interval are normal but the PP intervals vary at random and independent of any physiological function.

Ventriculophasic Sinus Arrhythmia


Figure 6 - Ventriculophasic Sinus Arrhythmia


For ventriculophasic sinus arrhythmia (Figure 6), the P to P interval encompassing a QRS complex are shorter than the intervals without an intervening QRS complex. Ventriculophasic sinus arrhythmia is noted in the presence of AV block.

Important difference between WAP and MAR/MAT

The basic ECG criteria for WAP is the GRADUAL change of P wave morphology which is a manifestation of passive GRADUAL transfer of dominant pacemaker. If it is NOT GRADUAL then the term is MULTIFOCAL ATRIAL RHTYHM (MAR).

Mutifocal atrial rhytm/ Multifocal atrial tachycardia belong to a group called Multifocal Atrial Arrhythmia (MAA). The electrocardiographic criteria for the diagnosis of MAA that includes both MAT (atrial rate  ≥ 100 beat/min) and MAR (atrial rate < 100 beats/min) consisted of a variable P-wave morphology of at least 3 different configurations and an irregular PP and PR interval. MAR and MAT are often misinterpreted as atrial fibrillation.

Multifocal atrial rhythm is seen as an irregular rhythm with different P wave morphologies at a rate that is less than 100 bpm. The change in P wave morphology is RANDOM and NOT GRADUAL.

Multifocal atrial tachycardia is the faster version of MAR (>100 bpm to about 150 bpm). MAT is also called CHAOTIC ATRIAL TACHYCARDIA. In general, at least 3 wave contours are noted, most of the P waves are conducted to the ventricles and often with variable PR intervals. This tachycardia often occurs commonly in older patients with chronic obstructive pulmonary disease (COPD) and congestive heart failure (CHF) and often develops into ATRIAL FIBRILLATION.  The management is directed primarily toward the underlying disease. Antiarrhythmic agents are frequently ineffective in slowing either the atrial tachycardia or the ventricular response. Beta adrenorenoreceptor blockers should be avoided but can be effective if tolerated. Some of you might have seen increase in heart rates after this patients are given beta agonist (as breathing treatment).


Back to the case


Figure 7 - ECG Case - Multifocal atrial rhythm/Multifocal atrial tachycardia

This is multifocal atrial rhythm/tachycardia. The wide QRS beats were interpreted as premature ventricular beats (PVB/PVC's) but actually those beats are aberrant beats with a right bundle branch block (RBBB)  morphology (R1,R3 and R6). The P wave before those wide beats are marked with red arrows. P11, P16 and P18 are ectopic atrial beats that are not conducted. During the course of events, this case had paroxysmal atrial fibrillation but stayed most of the time in MAR/MAT.

When you look at these strips, because of the irregularity, individual RR intervals will be less than 100 bpm or greater than 100 bpm. So, this rhythm spans both MAR/MAT depending on how the strip captured the rate. Most, often this rhythm will convert to atrial fibrillation.

Final view

Compare 3 cases of Wandering atrial pacemaker vs. Multifocal atrial rhythm/Multifocal rhythm. Notice the GRADUAL transfer of the dominant pacemaker in WAP vs. the RANDOM atrial events in MAR/MAT.


Figure 8 - Wandering atrial pacemaker


Figure 9 - Wandering atrial pacemaker


Figure 10 - Wandering atrial pacemaker - Notice the the gradual transition of the shape of the P wave. If you just see the mid-portion, it will look like ectopic atrial rhythm or even junctional rhythm. However, a long strip will reveal the gradual change in P.


Figure 11 - Mulfocal atrial rhythm/Multifocal atrial tachycardia

Update:

Here is an interesting ECG phenomenon that is being recognized as a unique entity - interatrial block. Here is the link - https://www.sciencedirect.com/science/article/pii/S0022073612002270?via%3Dihub

In this article, try to focus on second degree interatrial block. According to the article:

"In a typical case, the morphology of the P wave is
changing in the same recording from normal to
interatrial block pattern or from first-degree interatrial
block to third-degree interatrial block pattern or vice
versa, with or without relation to the preceding
premature beats, and may be considered as atrial
aberrancy, similarly to ventricular aberrancy".

Is this the same entity as MAR or is this a separate entity? This is an exciting phenomenon to watch as more data are known. We have to wait from the group of Drs Antonio Bayes de Luna and Adrian Baranchuk. What typically seen in the 2 phenomenon is the association of atrial arrhythmia/atrial fibrillation.

Additional Strips:


Figure 12 - Multifocal atrial tachycardia with hyperkalemia

References:

Aehlert B. 2002 ECG's Made Ease. Missouri. Mosby


Varriale P et al.1992. Multifocal Atrial Arrhythmia-A Frequent Misdiagnosis? A Correlative Study Using the Computerized ECG. Clinical Cardiology. 15,343-346


Wason W et al. 2007. Recommendations for the Standardization and Interpretation of the Electrocardiogram Part II: Electrocardiography Diagnostic Statement List A Scientific Statement From the American Heart Association Electrocardiography and Arrhythmias Committee, Council on Clinical Cardiology; the American College of Cardiology Foundation; and the Heart Rhythm Society. Circulation.115:1325-1332 -http://circ.ahajournals.org/content/115/10/1325.full.pdf


#621

12/22/2015

There is a reason to check the initiation of a tachycardia


A 70 yo c/o SOB.


Image 1

What is the rhythm?

This is a regular wide QRs tachycardia (WQRST) with a right bundle branch block (RBBB) morphology at aboout 150 bpm. The differential diagnosis could be ventricular tachycardia (VT) vs. supraventricular tachycardia (SVT) with aberrancy or SVT with fixed RBBB. V1 and V6 had a typical RBBB pattern. So, this is most likely a SVT. But which SVT?

According to the 2015 AHA SVT guideline: SVT is...

"An umbrella term used to describe tachycardias (atrial and/or ventricular rates in excess of100 bpm at rest), the mechanism of which involves tissue from the His bundle or above.These SVTs include inappropriate sinus tachycardia, AT (including focal and multifocalAT), macroreentrant AT (including typical atrial flutter), junctional tachycardia, AVNRT,and various forms of accessory pathway-mediated reentrant tachycardias"

Check the initiation strip

A way to look at SVT's is capture the initation of the arrhythmia.


Image 2 (20 sec telemetry strip)

The initiation strip showed sudden onset of the tachyarrhythmia. Distinct positive P waves can be seen on the latter part of the T waves. A positive P wave will rule-out reetrny tachyardia like AVNRT (typical/short RP or atypica/long RPl) because AVNRT will generate a negative P wave.


Image 3 (negative P waves in AVNRT)

As the tachycardia peaks, it will look like atrial flutter (AFL) as we can see in Image 4.


Image 4 (telemetry strip)

Because it looked AFL, diltiazem was given which revealed the separation of the P waves from the T waves.


Image 5 (telemetry strip when diltiazem was given)

The take home message here is in tachycardias, initiation strip can give you insight what is the tachycardia.

Final interpretration: Atrial tachycardia

#620


12/13/2015

Inferior Wall STEMI


An adult pt with history of hypertension and dyslipidemia was brought in due to chest pain.


The rhythm is sinus, right bundle branch block (RBBB) with ST elevations in III, II and aVF and ST depression in aVL. This is inferior wall ST elevation MI. 

Classic ECG Pattern

  • Greatest magnitude od ST elevation (in descending order) - III, aVF and II
  • Reciprocal ST depresion in aVL


Patients with STE in inferior leads (II, III and aVF) have occlusion in the right coronary artery (RCA) in 80-90%. Occlusion of the left circumflex artery (LCx) can produce similar pattern.

A nice table showing common ECG features distinguishing culprit artery in IWMI.


For the case

CAG showed RCA lesion, EF 50% and inferior hypokinesis on LVgram. Intervention  done.

Reference:

Alter S et al. 2006. Electrocardiographic Diagnosis of ST-elevation
Myocardial Infarction. Cardiol Clin 24 (2006) 343–365

#244

Sinus node reentrty tachycardia vs atrial reentry tachycardia


An adult pt is admitted due to SOB and managed as CHF. Echo showed EF in the 30's.


The basic rhythm is sinus (initial rate ~80's-100s) then there is abrupt decrease of rate (~ 50's bpm) with a slightly different P wave morphology (but still a normal PRI).

The differential diagnoses are: 

1. Inappropriate sinus tachycardia (IST)
2. Atrial reentry tachycardia (ART)near the sinus node
3. Sinoatrial reentry tachycardia (SART/SNRT)

IST is non-paroxysmal, elevated resting rate and gradual (excessive acceleration as reaction to mild exercise.However, as we  see in the strip, this is paroxysmal. Thus, IST is ruled-out.

ART - paroxysmal and difficult to differentiate from SART.

Sinus node reentry is defined as a reentrant tachycardia involving the sinus node and perinodal tissue.  It is possible that SNRT may represent a high cristal atrial tachycrdia (AT) originating near the sinus node . The features of SART/SNRT are:

The features of SART/SNRT are:

1. Abrupt onset/termination (may have gradual slowing)
2. Similar p-wave morphology compared to regular sinus beats (or may differ slightly)/ upright in leads II, III and aVF
3. Rate may vary from 80-140 bpm (ave apprx 100-110)

Thus, this is ART vs SART/SNRT.

References:

Das and Zipes. 2012. Electrocardiography of arrhythmias : a comprehensive review. Elsevier PA

Fisch C and Knoebel SB. 2000. Electrocardiography of Clinical Arrhytmias. Futura Pub NY

Mohammad-Reza et al.1985 Sinus Node Reentry: Case Report and Review of Electrocardiographic and Electrophysiologic Features. Texas Heart Institute 12(3) 249-252 - http://www.ncbi.nlm.nih.gov/.../pdf/thij00003-0044.pdf

Sanders et al. 1994. Catheter Ablation of Sinus Node Reentry Tachycardia. JACC 23 (4) 926-934

Simmers TA and Seeram N. 2003. Sinoatrial Reentry Teacycardia: A Review. Indian Pacing and Electrophsiology 3(3):109-116 - http://www.ncbi.nlm.nih.gov/.../PMC.../pdf/ipej030109-00.pdf

#242

12/12/2015

Nonconducted PAC in bigeminy

Elderly with HTN, dyslipidemia, S/P CABG is admitted for dizziness. BP in the 160's/90's. CBC, Trop, electrolyes - N. Brain MRI - neg.

What is the cause of the bradycardia? (asymptomatic during this event)


If you look closely at the T waves in V1 and compare the the complexes on the left and during the bradycardia, then you see that the T waves are "pointee". Those distortions in the T waves (clear in V1) are the PAC's. So, the bradycardia is due to non-conducted PAC's.

#236

Long RP tachycardia


A 50 yr old pt with LLQ pain and found to have a renal stone. 

What are the probable rhythm diagnosis?


The probable ECG interpretations are:
  • Atrial tachycardia
  • Atypical AV nodal reentry tachycardia (AVNRT) - fast-slow or fast antegrade and slow retrograde pathway.
  • Paroxysmal junctional reciprocating tachycardia - AV conduction over the AV node and the ventriculo-atrial conduction over a slowly conducting accessory pathway.


References:

Kistlet et al. 2006. P-wave Morhology in AT. JACC 48

Kumar UN et al. 2006. The 12L Electrocardiogram in Supraventricular Tachycardia. Cardiology Clinics ;24: 427-437

Wellens HJ. 1996. The Value of the ECG in the Diagnosis of SVT. EHJ 17:10-20 http://eurheartj.oxfordjournals.org/content/17/suppl_C/10.full.pdf


#231

12/11/2015

STEMI-mimic: Brugada Pattern or Brugada Phenocopy

A 70 yo with h/o of HTN c/o of fever.


Image 1-12 lead ECG

The rhythm is sinus tachycardia with ST elevations in V1 and V2. The initial interpretation was concerning for a STEMI. Cardiac cath was negative for any significant coronary occlusion. The investigation for fever was pursued.

Typical teaching would say that this could be septal MI but this ECG pattern is that of a Brugada ECG pattern (esp. type 1). 

Brugada syndrome of true congenital Brugada syndrome is sudden cardiac death syndrome with characteristic ECG pattern namely type 1 and type 2. This ECG pattern predisposes individuals to malignant ventricular arrhythymias. Other conditions can mimic this 2 ECG patterns. Thus the term Brugada pattern is used or Brugada phenocopy. A group/site dedicated to Brugada phenocopy can be found on this site - http://www.brugadaphenocopy.com/


Image 2 - Brugada Patterns

#619

12/02/2015

Atypical Wenckebach


Vignette: An elderly with pneumonia. What is your ECG diagnosis?


The rhythm is sinus. After QRS # 7, there is a non-conducted P wave. The PRI of the first conducted P wave is shorter compared to the last conducted P wave. There is also a prominent increase in the PRI on the second conducted P wave (QRS # 9). These are all hallmarks of second degree AV block type I (Mobitz I or AV Wenckebach). An interesting feature here is the PRI prior to the dropped beat is seemingly the same (but prolonged). Also, if you measure the PRI in V1, the PRI of the second conducted beat is seemingly the same after that. This is a hallmark of atypical Wenckebach. Thus, this is atypical Wenckebach. When the conduction ratio is more than 5:4 or 6:5, the PRI remains the same but prolonged. 

#227